Introduction
Data refers to information about a single or multiple entities, and organizing it effectively is crucial to understand the behaviour of a system. This is where data handling, a statistical analysis, comes into play. It involves collecting, regrouping, analysing, and presenting data through graphs, charts, and other visual aids. When we create graphs in presentations for our projects or say that 83% of voters liked ice cream over milk, we are engaging in data handling.
The main goal of data handling is to ensure the safe and orderly storage of data, making it easily accessible when needed. Voter polls, online surveys, and population statistics are real-life examples of data handling in action.
Data Handling Definition
Data handling is crucial for effectively managing research data and preventing unnecessary obstacles in accessing specific information. For example, if you have records of when you studied a particular topic and your notebooks are organised by date, you will be able to quickly find the notes for that particular topic.
Data handling involves organizing and securely storing data in electronic or non-electronic formats, such as desktops, CDs, notebooks, and journals. By properly handling data, organizations can present critical information accurately and predict the behaviour of the parameters involved in the data.
What is Data Handling
Data refers to a single or a group of information regarding an event or multiple events. To facilitate further analysis and research, it is crucial to organize and document the data effectively. Different statistical methods can be used to represent the data accurately, including bar graphs, line graphs, pie charts, histograms, and more.
For example, a data set representing the spending behaviour of different groups of people can be graphically represented through a bar graph that shows the spending amount (%) from their household savings, as seen in the figure below. Looking at the graph, you can easily infer which classes of people had the most spendings and which classes preferred to increase their savings. Data represented in visual format is far easier to understand than numbers and thus, data handling is an important statistical process.
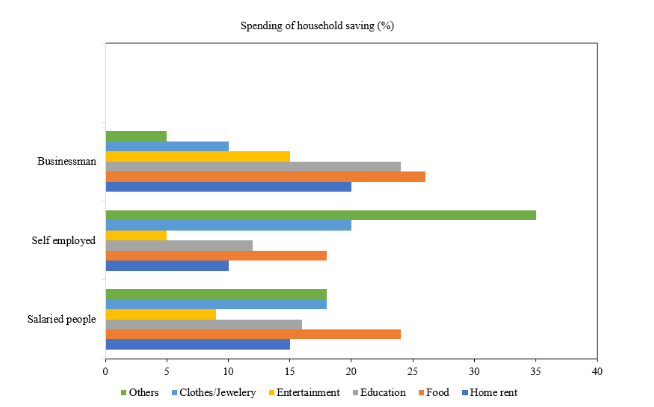
Bar Graph
Collection of Data
The data collection process is a critical step in data handling. The data to be analysed must be collected accurately and in a way that allows for proper grouping and analysis. For example, if a teacher wants to know the attendance record of each student in a particular class, they will need to gather attendance data from the register for each subject taught in that class. By calculating the attendance percentage of each student in each subject, the teacher can determine the attendance status of each student.
Data Handling made easy with our Maths Tuitions! Say goodbye to confusion and hello to clarity. Watch now and master this important skill.
However, imagine if the teacher accidentally included data from another class. An even more likely error can occur because it is easy to mix up the cells in a table and thus, wrong attendance can be marked. This will lead to incorrect calculations that will be of no use and hence, it is essential to collect data while ensuring correctness.
The Importance of Ensuring Accuracy and Appropriateness
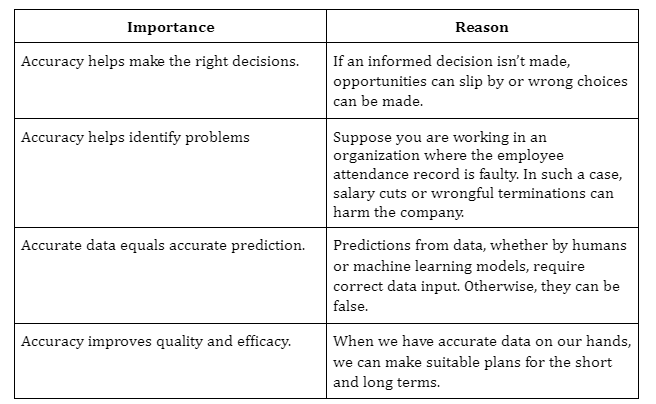
While collecting data, integrity is an essential component, and a data set is of best use when it is error-free and accurate. Otherwise, difficulties can arise in analysing it and performing analysis. Various factors related to ensuring accuracy are summarised below:
The Consequences of Improperly Collected Data
Various problems can arise when data is improperly or incorrectly collected. Here are a few:
- The data doesn’t line up with real-world scenarios and results and thus, the organisation deteriorates.
- Collecting unwanted or random data increases storage cost but has no benefit.
- The person conducting research on the data may get misguided due to incorrect data and provide wrong results.
- Incorrect data means incorrect predictions, which would lead to us making the wrong decisions.
- Incorrect data is invalid and cannot be reused again, increasing costs.
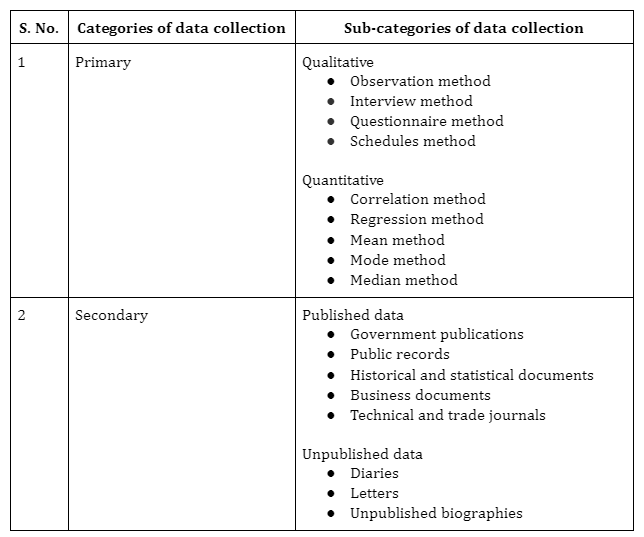
Methods
There are a number of data collection methods, which are summarised below:
Organization of Data
Organizing data accurately is a crucial aspect of data handling. It requires a systematic and accessible approach so that future readers of the data can obtain the desired results easily. The Oxford English Dictionary is an excellent example of effective organisation of a large set of data. With hundreds of thousands of words in the English language organised and grouped by alphabet, it is easy to find any word we want since they are ordered by the alphabet. Similarly, telephone books, global maps, and various other real-life data sets rely on effective organization and representation of large sets of data.
Types of Data
Classifying data helps us decide the type that will work best for our use-case. Data can be broadly divided into two types: qualitative and quantitative data.
Qualitative data provides descriptive information and characteristics about the variable in question. It can include how something is changing, if there are sudden dips or rises, etc.
On the other hand, quantitative data represents numerical or algebraic values like the average rainfall, average temperature, etc. Quantitative data itself may be discrete or continuous in nature.
Data Graphs
How to Represent Data
Data can be represented in a large number of ways, chief among which are:
- Bar graph
- Line graph
- Pictograph
- Histogram
- Stem and leaf plot
- Dot plots
- Frequency distribution
- Cumulative tables and graphs
Summary
In this article, we discussed an overview of data handling, including its advantages, types of data collection, and the consequences of incorrect data handling. We understood how and why data handling is a crucial component in various industries and management services. Finally, we summarised the various types and representations of data.
Frequently Asked Questions
1. Which type of graph represents data with pictures?
A pictograph includes the pictures to represent the data.
2. Are charts and graphs the same?
No. While all graphs can be considered as charts, the reverse may not be true.
3. Name graphical presentations of data other than bar graphs.
Data can be graphically represented via pie charts, histograms, scatter plots, area plots, etc.
4. What is the category of interview method?
Collecting data using interviews can be done either personally, or telephonically.
5. Out of qualitative and quantitative data, which is more effective?
For a short time period, quantitative data is cheaper and thus, is effective. However, over a large time interval, qualitative data becomes more helpful.
 Mission Statement
“Empower every student to achieve full potential”
88Guru has been established with the social objective of making quality video-based learning material available to all Indian students. Technology, Connectivity and Social Media are rapidly changing the world of Education and we wish to lead the transformation of the tuition industry in India.
88Guru is the perfect complement to the current tuition model. 88Guru creates a wonderful opportunity for children and parents to bond while engaging in a valuable learning activity. It also provides the complete curriculum at your fingertips for those moments when you need some help at short notice. We believe that this mode of tuition could be transformational, adding hours to a child's day while providing complete control over the learning process.
Every course is taught by the best teachers from India's top schools and conducted in an engaging manner to keep students involved. The e-learning process consists of video-based instructions, computer-graded assignments, and a dashboard which allows the student and parent to track progress.