An introduction
Graphs of many kinds may have appeared in publications and newspapers. Data is analyzed for a variety of purposes. We can identify kids who are overweight or underweight, for instance, if we gather information on the weights of the various students in a class. With the use of this information, we can suggest healthy eating to pupils who are underweight. Based on these facts, we can also create a chart. To understand data, many graphs are utilized. There are many uses for a bar graph, which is a sort of graph used to depict data. They are two-dimensional illustrations. Bars of varied heights are a useful tool for representing data. They typically serve to represent statistical and economic data. Let’s look at the chapter’s bar graph.
Definition of Bar Graph
A bar graph is a graph in which data is displayed as bars, with the height of the bars depending on the values they stand for. The bar may be vertical or horizontal. Bar charts are another name for them. Bar charts are used to compare independent variables. They are quite helpful in comprehending facts. A bar chart does not need that the data be in any particular arrangement. An x-axis and a y-axis with titles and labels are both present in a bar chart.
Bar Graph – Properties
- The width of each bar should be the same.
- Both horizontal and vertical bars are possible.
- The data the bar represents determines its height.
- A bar chart’s bars should all be based on the same line.
Types of Bar Graphs
There are two main categories of bar graphs:
- Vertical Bar Graph
- Horizontal Bar Graph
In addition to the above two categories, bar graphs can be categorized as follows:
- Grouped Bar Graph
- Stacked Bar Graph
Let us see these types of Bar Graphs in detail.
Vertical Bar Graph
Rectangular bars in a vertical bar graph are located along the y-axis and run vertically. All of the bars’ bases are along the x-axis. The values the bars stand for determine the heights of the bars.
Horizontal Bar Graph
All rectangular bars in this style of the bar graph are located on the x-axis. All of the bars’ bases are along the y-axis. The values the bars stand for determine the lengths of the bars.
Unlock your true potential with our Class 5 Maths Bar Graphs video! Practice makes perfect, so watch now and master the art of bar graphs in no time.
Stacked Bar Graph
In a stacked bar graph, different parts are represented by different colored bars. The composite bar chart is the name of it. Different parts of a bar stand for various categories. They are utilized to add more representational parameters.
Grouped Bar Graph
The clustered bar graph is another name for this form of a bar graph. Data can initially be categorized according to a main variable. Using a secondary variable, we may compare the information in each set. This kind of graph can employ both vertical bar charts and horizontal bar charts.

Types of Bar Graphs
Differences between Bar Graph and Histogram
Steps to draw a Bar Graph
Let’s use a class of 50 students as an illustration. There are15,6,10, and 19 students who arrive by bicycle, auto, foot, and bus, respectively.
- Determine the chart’s variables.
- Select the type of chart.
- Give the graph a name.
- Choose a date range for each axis.
- Sketch the x- and y-axes.
- Indicate the number of pupils on the x-axis.
- Indicate the mode of transportation on the y-axis.
- Draw the bar graph for each category based on the values.
Interesting facts
- Bar graphs offer a straightforward way to visualize complicated data.
- We can understand the data trend easily.
- Bar graphs are frequently used in both scientific and business reports.
Bar Graphs Solved examples:
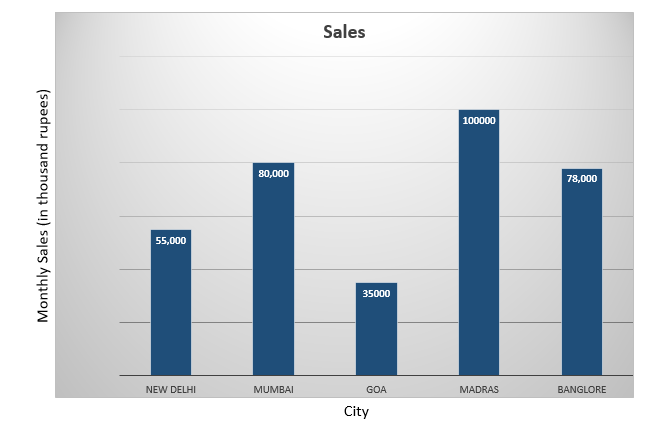
1. A business has locations in five cities. The information about the branches’ sales for August is shown below. Using these details as a foundation, create a bar graph.
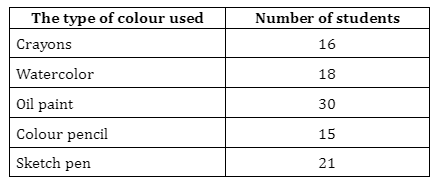
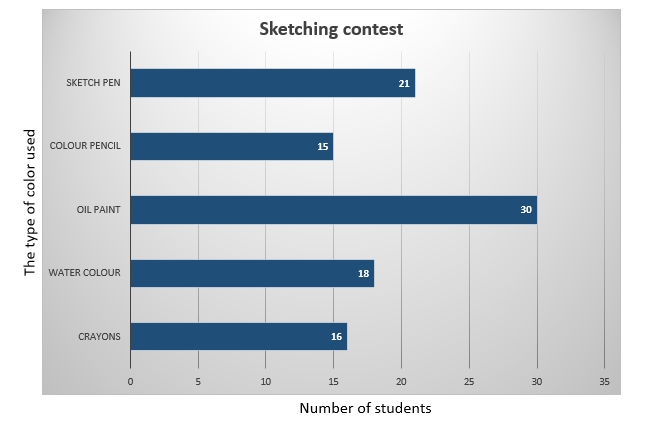
2. In a classroom, there was a sketching contest. Following are details about the amount of pupils and the colours they chose to use. Based on these facts, create a bar graph.
Conclusion
The definition of a bar graph, the distinctions between a bar graph and a histogram, and examples of several types of bar graphs were covered in this chapter.
Frequently Asked Questions
1. Explain the differences between a component bar chart and a percentage bar chart.
Each rectangle bar is broken down into different sub-components in a component bar chart. In a percentage bar chart, all bars have a magnitude of 100, and different components are displayed according to their percentage.
2. What are a stacked bar graph’s benefits and drawbacks?
Each rectangular bar in a stacked bar chart represents a key category. Subcategories are used to categorise each bar. It is used to compare different study parameters. This type of chart’s drawback is that it is challenging to grasp.
3. When would a bar graph be preferable to a line graph?
Line diagrams are helpful for showing more subtle alterations to a pattern over time. For analysing more significant shifts or differences in data between groups, bar graphs are preferable.
 Mission Statement
“Empower every student to achieve full potential”
88Guru has been established with the social objective of making quality video-based learning material available to all Indian students. Technology, Connectivity and Social Media are rapidly changing the world of Education and we wish to lead the transformation of the tuition industry in India.
88Guru is the perfect complement to the current tuition model. 88Guru creates a wonderful opportunity for children and parents to bond while engaging in a valuable learning activity. It also provides the complete curriculum at your fingertips for those moments when you need some help at short notice. We believe that this mode of tuition could be transformational, adding hours to a child's day while providing complete control over the learning process.
Every course is taught by the best teachers from India's top schools and conducted in an engaging manner to keep students involved. The e-learning process consists of video-based instructions, computer-graded assignments, and a dashboard which allows the student and parent to track progress.