Introduction
The rate of change in displacement of a moving object is referred to as its velocity. As a result, velocity is a vector quantity, and the velocity-time graph or velocity-time relation is a graphical representation of its fluctuation with time. A velocity-time graph shows the variation of the object’s velocity with time, under different conditions, such as under uniform motion, and under acceleration. On a velocity-time graph, acceleration is depicted by the slope of the graph line.
Velocity-Time Graph for Uniform Motion (No acceleration)
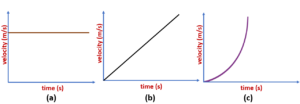
Since there is no acceleration being given to the moving object in this scenario, its velocity is constant and does not fluctuate over time. As a result, in this scenario, it is clear from Figure (a) below that despite the change in time, the velocity will remain constant throughout the entire journey of the object.
Velocity-Time Graph with a Constant Uniform Acceleration
In this situation, the item is subject to a constant uniform acceleration, so depending on the applied uniform acceleration—referred to as the accelerating and retarding acceleration, respectively—its velocity will constantly grow or decrease. We see a linear behaviour of the object’s velocity with time in the velocity-time graph (as shown below in Figure (b)), where the velocity of the item grows linearly on the application of constant uniform acceleration. You can use the slope of this graph to calculate the object’s applied acceleration.
The object’s equations of motion under a uniform constant acceleration can be expressed as follows:
v = u + at
s = ut + 1/2 at²
v² = u² + 2as
Where v, u, a, s, and t are the final velocity, initial velocity, uniform acceleration, total displacement of the object, and travel/trip time, respectively.
Velocity-Time Graph under a Variable Acceleration
As shown in Figure (c) above, in this situation, the acceleration acting on the object varies with time and as a result, the object’s variation in velocity is different during each time period of the journey. As a result, we observe a velocity-time graph that differs from the case where the object is subjected to variable acceleration and observe a parabolic behaviour of velocity with time.
Summary
The rate of change of displacement is known as velocity. The slope of the curves on the velocity-time graphs indicates how quickly the item is accelerating. Any object’s velocity is determined by the rate at which its displacement changes, so its starting and ending positions are crucial.
Frequently Asked Questions
1.What is the Initial and Final Velocity?
Ans: An object’s initial velocity is its speed at time zero, or when it first begins moving, and its final velocity is its speed when the journey has come to an end.
2. State the difference and Similarity between Speed and Velocity.
Ans: The pace at which a distance changes is known as an object’s speed, whereas the rate at which its displacement changes is known as its velocity. Speed and velocity are scalars and vector quantities because distance and displacement are, respectively, scalar and vector quantities. Since both distance and displacement are expressed in meters, there is an m/s correspondence between speed and velocity.
3. What are the differences between Velocity and Acceleration?
| Attributes | Velocity | Acceleration |
| Definition | The speed of an object in a given direction. | Acceleration implies any change in the velocity of the object with respect to time. |
| Calculated with | Displacement. | Velocity |
| What is it? | Rate of change of displacement. | Rate of change of velocity. |
| Formula | Displacement/Time | Velocity/Time |
| Unit of Measurement | Meter/Second | Meter/second² |
4. What do Velocity Time Graphs Show?
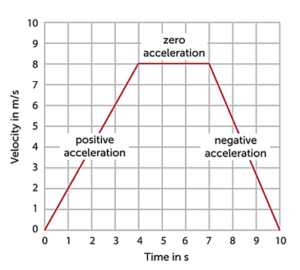
Ans: A velocity-time graph displays the sprinter’s object’s changing speed, as well as the speed of any other moving item or person. The slope of the graph line on a velocity-time graph is used to illustrate acceleration. If the line slopes downhill, as it does between 7 and 10 seconds, then acceleration is negative, and velocity is dropping.
 Mission Statement
“Empower every student to achieve full potential”
88Guru has been established with the social objective of making quality video-based learning material available to all Indian students. Technology, Connectivity and Social Media are rapidly changing the world of Education and we wish to lead the transformation of the tuition industry in India.
88Guru is the perfect complement to the current tuition model. 88Guru creates a wonderful opportunity for children and parents to bond while engaging in a valuable learning activity. It also provides the complete curriculum at your fingertips for those moments when you need some help at short notice. We believe that this mode of tuition could be transformational, adding hours to a child's day while providing complete control over the learning process.
Every course is taught by the best teachers from India's top schools and conducted in an engaging manner to keep students involved. The e-learning process consists of video-based instructions, computer-graded assignments, and a dashboard which allows the student and parent to track progress.