

1. Find the range of heights of any ten students in your class.
1. Find the range of heights of any ten students in your class.
Explanation:
To find the range of heights of ten students in the class, we first need to gather the data on their heights. Let's us take the heights of 10 students in class are:
129, 132, 136, 137, 139, 141, 142, 142, 146, 148
To find the range of heights it is required to have the highest and lowest value.
From the given heights,
It is observed that
Highest height, Fh 148 cm
Lowest height. Lh=129 cm
Once the highest and lowest values is found then range can be calculated by subtracting Lh from Hh.
Range students height = (Hh -LI)
= 148 cm-129 cm
=19 cm
Therefore, the range of heights of the ten students in your class is 18 cm.
2. Organise the following marks in a class assessment in a tabular form. 4,6,7,5,3,5,4,5,2,6,2,5, 1, 9, 6, 5,8,4,6,7
(i) Which number is the highest?
(ii) Which number is the lowest?
(iii) What is the range of the data?
(iv) Find the arithmetic mean.
2. Organise the following marks in a class assessment in a tabular form. 4,6,7,5,3,5,4,5,2,6,2,5, 1, 9, 6, 5,8,4,6,7
(i) Which number is the highest?
(ii) Which number is the lowest?
(iii) What is the range of the data?
(iv) Find the arithmetic mean.
Explanation:
Sure, here's the table organized in ascending order:
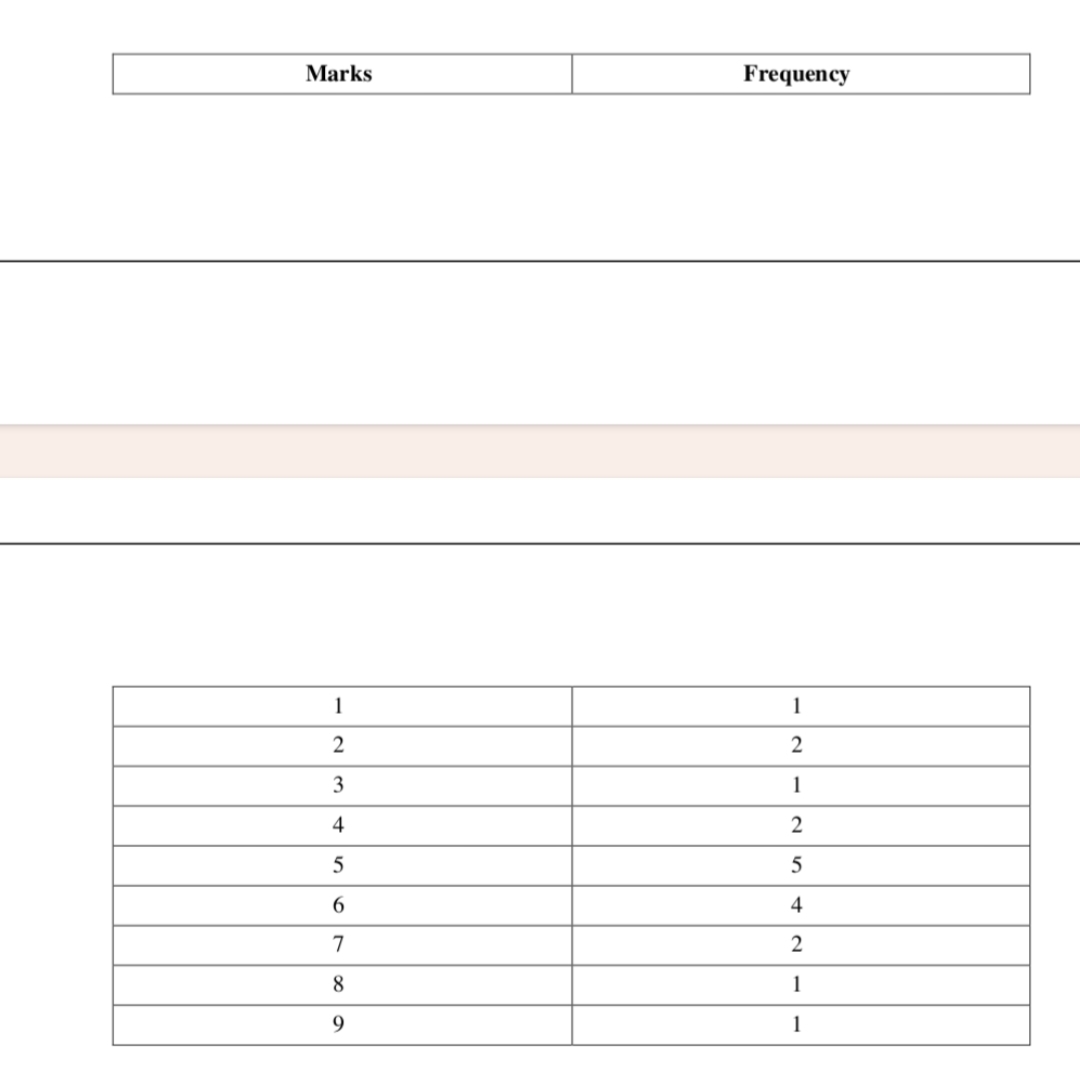
(i) The highest number in the table is 9.
(ii) The lowest number in the table is 1.
(iii) The data range can be calculated by subtracting the highest and lowest numbers, which is
Highest number-Lowest number=9-1=8 As a result, the data range is 8.
(iv) To calculate the arithmetic mean, add all of the marks and divide by the total number of marks The total of all marks is 4+6+7+5+3+5+4+5+2+6+2+5+1+9+6+5+8+4 +6 +7=100 There are a total of 20 marks, so the arithmetic mean is: Arithmetic Mean Total number of marks/Sum of all marks 100/20 5 As a result, the data's arithmetic mean is 5.
3.Find the mean of the first five whole numbers
3.Find the mean of the first five whole numbers
Explanation:
The first five whole numbers are 1,2,3,4, and 5.
To find the mean, add these numbers together and divide by the total number of observation that is 5.
Hence, the mean of the first five whole numbers can be calculated as:
Mean=(1+2+3+4+5)/5
15/5 =3
Hence, the mean of the first five whole numbers is 3.
4. A cricketer scores the following runs in eight innings: 58,76, 40, 35, 46, 45, 0, 100. Find the mean score.
4. A cricketer scores the following runs in eight innings: 58,76, 40, 35, 46, 45, 0, 100. Find the mean score.
Explanation:
To find the mean score of the cricketer, we need to add up the total runs scored in all innings and divide it by the no. of innings played. Therefore: Total runs scored in all innings by the cricketer 58+ 76 +40 +35 +46 +45 +0+100-400
Total number of innings played 8
So, therefore mean score can be calculated as:
Mean score = Total runs scored/ Number of innings played
=400/8 =50
Hence, the mean score 50.
5. Following table shows the points each player scored in four games:
(i) Find the mean to determine A's average number of points scored per game.
(ii) To find the mean number of points per game for C, would you divide the total points by 3 or by 4? Why?
(iii) B played in all four games. How would you find the mean?
(iv) Who is the best performer?
5. Following table shows the points each player scored in four games:

(i) Find the mean to determine A's average number of points scored per game.
(ii) To find the mean number of points per game for C, would you divide the total points by 3 or by 4? Why?
(iii) B played in all four games. How would you find the mean?
(iv) Who is the best performer?
Explanation:
(1) To find A's average number of points scored per game, it is required to find the mean of the points scored in total; no. of games played by A.
Mean score for A= (14+16+10+10)/4=125
As a result, A's average number of points per game is 12.5.
(ii) To calculate C's mean number of points per game, divide the total points scored by the number
of games played. We should divide the total points scored by 3 because C did not play in Game 4.
(iii) To calculate the mean number of points per game for B, we must average the points scored in all four games played by R
B's mean score is (0+8+6+4)/4=45.
As a result, B's average number of points per game is 4.5. (iv) To determine the best performer, we must consider each player's total points scored across all games.
Total points scored by A= 14+16+ 10+10=50
Total points scared by B=0+8+6+4=18
Total points scored by C-8+11+0+13=32
Therefore, A is the best performer with a total of 50 points scored.
6. The marks (out of 100) obtained by a group of students in a science test are 85. 76.
90,85, 39, 48, 56, 95, 81 and 75. Find the:
(i) Highest and lowest marks obtained by the students.
(ii) Range of the marks obtained.
(iii) Mean marks obtained by the group.
6. The marks (out of 100) obtained by a group of students in a science test are 85. 76.
90,85, 39, 48, 56, 95, 81 and 75. Find the:
(i) Highest and lowest marks obtained by the students.
(ii) Range of the marks obtained.
(iii) Mean marks obtained by the group.
Explanation:
Students received the following scores on the science exam:
85,76,90.85, 39, 48, 56, 95.81.75. Rearranging the numbers in ascending order gives
39, 48, 56, 75, 76, 81, 85, 85, 90, 95.
As a result of the marks, the highest marks obtained by the students = 95.
The Lowest marks received by the students = 39
(ii) We can find the range by subtracting the lowest score from the highest score.
Range 953956.
(iii) To calculate the group's mean score, add all of the scores and divide by the number of scores.
Mean = (85+ 76 +90 +85 +39 +48 +56 +95 +81 +75)/10=73.
7. The enrolment in a school for six consecutive years was as follows: 1555, 1670, 1750, 2013, 2540, 2820. Find the mean enrolment of the school for this period.
7. The enrolment in a school for six consecutive years was as follows: 1555, 1670, 1750, 2013, 2540, 2820. Find the mean enrolment of the school for this period.
Explanation:
To calculate the school's mean enrolment for this time period, add the total enrolment and divide by the number of years.
Total enrolment = 1555 +1670 +1750+2013+2540+2820=12348
Number of years = 6
Mean enrolment = Total enrolment / Number of years =12348/6
=2058
Therefore, the mean enrolment for this period=2058.
8. The rainfall (in mm) in a city on 7 days of a certain week was recorded as follows: Mon
Day. Rainfall ( in mm)
Tue 0.0
Wed. 12.2
Thurs. 2.1
Fri. 0.0
Sat. 20.5
Sun. 5.5
(i) Find the range of rainfall in the above data. (ii) Find the mean rainfall for the week.
(iii) on how many days was the rainfall less than the mean rainfall?
Explanation:
(1) To calculate the range of rainfall, subtract the smallest value from the largest value.
Range largest value - smallest value 20.5-0.0
=20.5
Therefore, the range of rainfall = 205 mm.
(ii) To calculate the average rainfall for the week, add all of the rainfall values and divide the total by the number of days. Total rainfall 00+12.2+2.1+00+205+5.5+10
41.3
Mean rainfall = Total rainfall / Number of days
41.3/7
-5.9 mm
Therefore, the mean rainfall for the week 5.9 mm
(iii) We know that the mean rainfall for the week is 5.9 mm. To find how many days had rainfall less than this mean, we need to count the number of values less than 5.9 mm.
Days with rainfall less than the mean: Mon, Wed, Thurs. Sun.
Therefore, the rainfall was less than the mean on 4 days.
9. The heights of 10 girls were measured in cm, and the results are as follows 135, 150, 139, 128, 151, 132, 146, 149, 143, 141.
(i) What is the height of the tallest girl?
(ii) What is the height of the shortest girl?
(iii) What is the range of the data?
(iv) What is the mean height of the girls?
(v) How many girls have heights more than the mean height?
Explanation:
Arranging the given data in ascending order,we get... = 128, 132, 135, 139, 141, 143, 146, 149, 150, 151
(1) The height of the tallest girl is simply the largest value in the dataset, which is 151 cm.
(ii) The height of the shortest girl is the smallest value in the dataset, which is 128 cm.
(iii) The range of the data is a measure of how spread out the dataset is, and is calculated by subtracting the smallest value from the largest value. In this case, the range is 151-128=23 cm.
(iv) To calculate the average height of the girls, add all of their heights and divide by the number
of girls. We have ten girls in this case, so we add all of their heights and divide by ten:
Mean height (135+150+139+128+151+132+146+149+143+141/10=1414 cm (rounded to on
decimal place).
(v) To find out how many girls are taller than the average, we simply count the number of girls
who are taller than 141.4 cm. Looking at the dataset, we can see that there are 5 girls who are taller
than the average:
150 cm
151 cm
146 cm
149 cm
143 cm
These 5 heights are greater than the mean height of 1414 cm, indicating that there are 5 girls who are taller than the average.
10. The scores on the Mathematics test (out of 25) of 15 students are as follows: Find the mode and median of this data. Are they the same?
19, 25, 23, 20, 9, 20, 15, 10, 5, 16, 25, 20, 24, 12, 20
10. The scores on the Mathematics test (out of 25) of 15 students are as follows: Find the mode and median of this data. Are they the same?
19, 25, 23, 20, 9, 20, 15, 10, 5, 16, 25, 20, 24, 12, 20
Explanation:
Lets arrange the given scores in ascending order, we get: 5,9, 10, 12, 15, 16, 19, 20, 20, 20, 20, 23, 24, 25, 25
Mode:
The mode is the value that appears most frequently in the dataset. Here, the value 20 appears four times, which is more than any other value in the dataset. Therefore, the mode of the given scores is 20.
The mode is 20
Median:
The median is the value of the dataset's middle observation. To calculate the median, we must first arrange the scores in ascending order.
The scores are already in ascending order in this case. Because there are 15 scores, which is an odd number, the median is the eighth score. The eighth score is also twenty.
As a result, the median of the given scores is 20.
The median is 20
Are the mode and median the same?
Yes, both the mode and median of the given scores are equal to 20.
11. The runs scored in a cricket match by 11 players are as follows: 6, 15, 120, 50, 100, 80, 10, 15, 8, 10, 15 Find the mean, mode and median of this data. Are the three same?
11. The runs scored in a cricket match by 11 players are as follows: 6, 15, 120, 50, 100, 80, 10, 15, 8, 10, 15 Find the mean, mode and median of this data. Are the three same?
Explanation:
Arranging the given scores in ascending order, we get; 6,8, 10, 10, 15, 15, 15, 50, 80, 100, 120
The mean is the average of all the scores in the dataset. To find the mean, we add up all the scores and divide by the total number of scores:
Mean:
Mean = (6+8+10+10+15+ 15 +15+50+80+100+120) / 11
Mean = 438 / 11
Mean=39.81 (rounded to two decimal places)
The mode is the value that occurs most frequently in the dataset. Here, the value 15 appears three
Mode: times, which is more than any other value in the dataset. Therefore, the mode of the given scores is 15.
Median: Since we have II scores, which is an odd number, the median is the middle score, which is the 6th
score:
Its given by:
Median = value of ½ (n+1)th observation
Median = value of ½ (11+1)th observation
Median = value of 6th observation
Median = 15
Are the mean, mode, and median the same?
No, the mean, mode, and median of the given scores are different. The mean is 39.81, the mode is 15, and the median is also 15.
12. The weights (in kg.) of 15 students of a class are:
38, 42, 35, 37, 45, 50, 32, 43, 43, 40, 36, 38, 43, 38, 47
(i) Find the mode and median of this data.
(ii) Is there more than one mode?
12. The weights (in kg.) of 15 students of a class are:
38, 42, 35, 37, 45, 50, 32, 43, 43, 40, 36, 38, 43, 38, 47
(i) Find the mode and median of this data.
(ii) Is there more than one mode?
Explanation:
Arranging the given weights of 15 students of a class in ascending order, we get 32.35, 36, 37, 38, 38, 38, 40, 42, 43, 43, 43, 45, 47, 50
(i) Find the mode and median of this data. To find mode we makes a frequency table:
Explanation:

Therefore, the mode and median of the given weights are 38 and 40, respectively. (ii) Is there more than one mode?
To determine whether there is more than one mode, we need to check if any other value occurs with the same frequency as the mode. In this case, there are two values that occur with the same frequency, so there are two mode in the given data.
13. Find the mode and median of the data: 13, 16, 12, 14, 19, 12, 14, 13, 14
13. Find the mode and median of the data: 13, 16, 12, 14, 19, 12, 14, 13, 14
Explanation:
We first list out the distinct values in the data set and then count how many times each value appears. The value with the highest frequency is the mode.

From the frequency , we can see that the value 14 appears three times, which is more than any other value in the dataset.
Therefore, the mode of the given data is 14.
To find the median. we first need to arrange the data in ascending order:
12. 12, 13, 13, 14, 14, 14, 16, 19
Since we have 9 data points, which is an odd number, the median is the 5th data point: Median value of ½ (n + 1)th observation Median = value of 5th observation Median = 14
Median = value of % (9+1)th observation
Therefore, the mode and median of the given data are 14. middle data point
14. Tell whether the statement is true or false.
The mode is always one of the numbers in a data.
14. Tell whether the statement is true or false.
The mode is always one of the numbers in a data.
Explanation:
The statement. "The mode is always one of the numbers in a data" is true.
Since, the mode is defined as the value in a data set that occurs most frequently.
Therefore, by definition, the mode must be one of the values in the collection of that particular data
15.The mean is one of the numbers in the data.
15.The mean is one of the numbers in the data.
Explanation :
The mean is one of the numbers in the data. Explanation(ii) :
This statement is not necessarily true
For example, consider the data 1,2,3. The mean of this data is:
mean = (1+2+3)/3-2 In this case, the mean is one among the numbers in the given group of data. However, if we add another value to the data set, such as {1,2,3,4), the mean becomes:
mean =(1+2+3+4)/4=2.5
In this case, the mean is not one of the numbers in the data set.
16.The median is always one of the numbers in a data.
16.The median is always one of the numbers in a data.
Explanation:
The statement is incorrect.
in the data set, and since the middle value must be one of the numbers in the data set, this
→ In situations where there are an even number of values in a data set, the median is calculated
by finding the average of the two middle-most observations. It is important to note that the median may not correspond to any of the actual data points.
→ Because, when the number of values in a given data is odd, the median is the middle value statement holds true.
17.The data 6,4,3,8,9, 12, 13, and 9 have the mean 9.
17.The data 6,4,3,8,9, 12, 13, and 9 have the mean 9.
Explanation:
The statement given above is false.
To check, we can find the mean of the data 6, 4.3,8,9, 12, 13, and 9 as follows
Mean (6+4+3+8+9+12+13+9)/8
=64/8
= 8
Therefore, the mean of the data is 8. not 9.
18. Use the bar graph (Fig 3.3) to answer the following questions. (a) Which is the most popular pet? (b) How many students have dogs as a pet?
18. Use the bar graph (Fig 3.3) to answer the following questions. (a) Which is the most popular pet? (b) How many students have dogs as a pet?

Explanation:
(a) The most popular pet is the cat as it is owned by 10 out of 12 students, which is the highest number of pets owned by any of the categories shown in the graph.
(b) From the bar graph, we can see that the number of students who have dogs as pets is represented by the height of the "Dogs" bar. According to the graph, the height of the "Dogs" bar corresponds to 8 students, which means that 8 out of the 12 students have dogs as their pets,
19.Read the bar graph (Fig 34), which shows the number of books sold by a
(i) About how many books were sold in 1989, 1990 and 1992? bookstore during five consecutive years, and answer the following questions.
(ii) In which year was about 475 books and 225 books sold?
(iii) In which years were fewer than 250 books sold?
(iv) Can you explain how you would estimate the number of books sold in 1989?

Explanation:
Years
1992
(1) Based on the given bar graph, we can estimate the number of books sold in each year as follows:
In 1989, Books sold 175 In 1990, Books sold = 475
In 1991, Books sold = 350
In 1992, Books sold 225
In 1993, Books sold = 275
(ii) In 1990, approximately 475 books were sold, and 225 books were sold in 1992,
(iii) The years in which fewer than 250 books were sold are 1989 and 1992.
(iv) We can use the scale provided in the graph to estimate the number of books sold in 1989.
According to the scale, I em on the griph corresponds to 100 books. The 1989 bur measures approximately 1.75 cm in length.
As a result, we can estimate the number of books sold in 1989 to be:
= 1.75 x 100 = 175 books.
20. Number of children in six different classes is given below. Represent the data on a bar graph.
(a) How would you choose a scale?
(b) Answer the following questions:
(i) Which class has the maximum number of children? And the minimum? (ii) Find the ratio of students of Class six to the students of Class

120/100 = 12/10= 6/5
So, the ratio of class 6 students to the students in class 8 is 6:5
21. The performance of a student in the 1st Term and 2nd Term is given. Draw a
double bar graph by choosing an appropriate scale and answer the following:
Subject
English
Hindi
Maths
Science
S. Science
1st Term (M.M. 100)
67
72
88
73
2nd Term (M.M. 100)
70
65
95
85
75
(1) In which subject has the child improved his performance the most? (ii) In which subject is the improvement the least?
(iii) Has the performance gone down in any subject?
Explanation:

22. Consider this data collected from a survey of a colony. Favourite Sport
Cricket
Basket Ball
swimming
Hockey
Athletics
Watching
1240
470.
510
430
250
Participating
620
320
320
250
105
(i) Draw a double har graph choosing an appropriate scale.
What do you infer from the bar graph?
(ii) Which sport is most popular?
(iii) Which is more preferred, watching or participating in sports?
Explanation:
(1) From the double bar graph, we can infer that cricket is the most popular sport among both
watching and participating. We can also see that more people prefer to watch sports than to
participate in them.
(ii) Cricket is the most popular sport, with 12.4 cm of the bar representing people who like to watch
cricket, and 6.2 cm representing people who like to participate in cricket.
More people prefer to watch sports than to participate in them. For example, the bar for
watching cricket is 12.4 cm, while the bar for participating in cricket is only 6.2 cm. This is true
for all sports in the given data.
23. Take the data giving the minimum and the maximum temperature of various
cities given in the beginning of this Chapter (Table 3.1). Plot a double bar graph using the data and answer the following:
City
Max.
Min.
Ahmedabad
38°C
29°C
Amritsar Bangalore
37°C
26°C
28°C
21°C
Chennai
36°C
27°C
Delhi
38°C
28°C
Jaipur
39°C
29°C
Jammu
41°C
26°C
Mumbai
32°C
27°C
(i) Which city has the largest difference in the minimum and maximum temperature on the given date?
(ii) Which is the hottest city and which is the coldest city!
(iii) Name two cities where the maximum temperature of one was less than the minimum temperature of the other. (iv) Name the city which has the least difference between its minimum and the maximum temperature.
Explanation:

(iii) Ahmedabad and Delhi are two cities where the maximum temperature of one was less than the minimum temperature of the other. In Ahmedabad, the maximum temperature was 38°C and the minimum was 29°C, while in Delhi, the maximum temperature was 38°C and the minimum was 28°C.
(iv) Mumbai has the least difference between its minimum and maximum temperature, with a difference of 5°C (32°C - 27°C).
24. Tell whether the following is certain to happen, impossible, or can happen but not certain. You are older today than yesterday.
24. Tell whether the following is certain to happen, impossible, or can happen but not certain. You are older today than yesterday.
Explanation:
Certain to happen, because you are definitely older than yesterday as today it is 24 hours bigger than yesterday.Also, because time is always moving forward and we are constantly aging with every passing day.
25. A tossed coin will land heads up.
25. A tossed coin will land heads up.
Explanation:-
Can happen but not certain because a tossed coin will land heads up is not certain. This is because the outcome of a coin toss is random and can result in either heads or tails. It's a 50-50 chance
26.A die, when tossed, shall land up with 8 on top.
26.A die, when tossed, shall land up with 8 on top.
Explanation:
A die, when tossed, shall land up with 8 on top: Impossible. This is because a standard die only has six sides with numbers ranging from 1 to 6. It is not possible for a die to land on the number
27. The next traffic light seen will be green.
27. The next traffic light seen will be green.
Explanation:
Can happen but not certain. This is because the sequence of traffic lights changing colors is determined by a pre-programmed timer or sensors that detect the presence of vehicles. It's possible that the next traffic light seen can be green, but it's not an absolute possibility.
28.Tomorrow will be a cloudy day.
28.Tomorrow will be a cloudy day.
Explanation:
Can happen but not certain. This is because weather forecasts are based on a variety of factors and are not always 100% accurate. While meteorologists may make an educated prediction, there are still many variables that can affect the weather and make it different from what was forecasted.
29. There are 6 marbles in a box with numbers from 1 to 6 marked on each of them. What is the probability of drawing a marble with the number 2?
29. There are 6 marbles in a box with numbers from 1 to 6 marked on each of them. What is the probability of drawing a marble with the number 2?
Explanation:
The probability of drawing a marble with the number 2 can be calculated by dividing the number
of marbles with the number 2 by the total number of marbles in the box.
Since there is only one marble with the number 2 in the box and there are a total of six marbles in the box, the probability of drawing a marble with the number 2 is 1/6 or approximately 0.1667 (rounded to four decimal places).
Therefore, the probability of drawing a marble with the number 2 is 1/6.
30. A coin is flipped to decide which team starts the game. What is the probability that your team will start?
30. A coin is flipped to decide which team starts the game. What is the probability that your team will start?
Explanation:
From the given information, we know that a coin is flipped to decide which team starts the game.
Since there are two possible outcomes when flipping a coin (heads or tails) and we want to find the probability of getting heads, which means our team will start, the probability is:
Favorable outcomes = 1
Total Possible outcomes = 2
Probability of getting heads = Number of favorable outcomes/Total number of possible outcomes
Probability of getting heads = 1/2
So, the probability of our team starting is 0.5 or we can say there is a 50% chance.