

1. A survey was conducted by a group of students as a part of their environment awareness programme, in which they collected the following data regarding the number of plants in 20 houses in a locality. Find the mean number of plants per house.
Which method did you use for finding the mean and why?
1. A survey was conducted by a group of students as a part of their environment awareness programme, in which they collected the following data regarding the number of plants in 20 houses in a locality. Find the mean number of plants per house.
Which method did you use for finding the mean and why?
Explanation:
We utilise the direct method because there are not many plants or dwellings and their prices are low.

Mean = 8.1

So, there are 8.1 plants on average for each home.
2. Consider the following distribution of daily wages of 50 workers of a factory.
Find the mean daily wages of the workers of the factory by using an appropriate method.
2. Consider the following distribution of daily wages of 50 workers of a factory.

Find the mean daily wages of the workers of the factory by using an appropriate method.
Explanation:

Given the information, suppose mean = 150, class’s Width = 20
=

Mean = = 150 – 4.8 = 145.2
Hence, the average daily wage for manufacturing workers is Rs. 145.20.
3. The following distribution shows the daily pocket allowance of children of a locality. The mean pocket allowance is Rs.18. Find the missing frequency
3. The following distribution shows the daily pocket allowance of children of a locality. The mean pocket allowance is Rs.18. Find the missing frequency

Explanation:

Given the information, suppose mean = 18

Thus, 20 percent of the frequency is missed.
4. Thirty women were examined in a hospital by a doctor and the number of heartbeats per minute was recorded and summarized as follows:
4. Thirty women were examined in a hospital by a doctor and the number of heartbeats per minute was recorded and summarized as follows:
Explanation:

5. In a retail market, fruit vendors were selling mangoes kept in packing boxes. These boxes contained varying numbers of mangoes. The following was the distribution of mangoes according to the number of boxes.

Find the mean number of mangoes kept in a packing box. Which method of finding the mean did you choose?
5. In a retail market, fruit vendors were selling mangoes kept in packing boxes. These boxes contained varying numbers of mangoes. The following was the distribution of mangoes according to the number of boxes.
Find the mean number of mangoes kept in a packing box. Which method of finding the mean did you choose?
Explanation:
Due to the enormous numerical values of the number of mangoes and the number of boxes. Hence, we employ the step-deviation method.

Suppose mean = 57, Width of the class = 3
= (approx.)

Mean = 57 + 3 (0.0625) = 57 + 0.1875 = 57.1875 = 57.19 (approx.)
The average number of mangoes stored in a box is 57.19.
6. The table below shows the daily expenditure on the food of 25 households in a locality:
6. The table below shows the daily expenditure on the food of 25 households in a locality:

Explanation:

Suppose mean = 225, class’s width = 50
=

Mean = 225 + 50 (– 0.28) = 225 – 14 = 211
Hence, the average daily cost of food is Rs. 211.
7. To find out the concentration of SO2 in the air (in parts per million, i.e., ppm), the data was collected for 30 localities in a certain city and is presented below:
Find the mean concentration of SO2 in the air.
7. To find out the concentration of SO2 in the air (in parts per million, i.e., ppm), the data was collected for 30 localities in a certain city and is presented below:
Find the mean concentration of SO2 in the air.
Explanation:

Suppose mean = 0.10, class’s Width = 0.04
= (approx.)

Mean = 0.10 + 0.04 (– 0.033) = 0.10 – 0.0013 = 0.0987 (approx.)
Hence, the average SO2 concentration in the air is 0.0987 ppm.
8. A class teacher has the following absentee record of 40 students of a class for the whole term. Find the mean number of days a student was absent.
8. A class teacher has the following absentee record of 40 students of a class for the whole term. Find the mean number of days a student was absent.
Explanation:

Suppose mean = 17
= = 12.48

Hence, the average number of days a student missed was 12.48.
9. The following table gives the literacy rate (in percentage) of 35 cities. Find the mean literacy rate.

9. The following table gives the literacy rate (in percentage) of 35 cities. Find the mean literacy rate.
Explanation:

Suppose mean = 70, Class’s Width = 10
=

Mean = 70 + 10 (– 0.057) = 70 – 0.57 = 69.43
As a result, the mean literacy rate is 69.43%.
10. The following table shows the ages of the patients admitted to a hospital during a year:
Find the mode and the mean of the data given above. Compare and interpret the two measures of central tendency.
10. The following table shows the ages of the patients admitted to a hospital during a year:
Find the mode and the mean of the data given above. Compare and interpret the two measures of central tendency.
Explanation:
Consider Mode: The maximum frequency in the provided data is 23, which corresponds to the class range of 35 to 45.
Modal class presented = 35 – 45
And and
Mode =

=

=
=
= 35 + 1.8
= 36.8
Consider Mean:

Suppose mean = 30, class Width = 10
=

Mean = 30 + 10 (0.5375) = 30 + 5.375 = 35.37
As a result, the mean and mode of the presented data are 35.37 and 36.8 years, respectively.
The average age of a patient admitted to the hospital is 35.37 years old, and the oldest patient admitted to the hospital is 36.8 years old, as is also evident from the discussion above.
11. The following data gives information on the observed lifetimes (in hours) of 225 electrical components:
Determine the modal lifetimes of the components.
11. The following data gives information on the observed lifetimes (in hours) of 225 electrical components:

Determine the modal lifetimes of the components.
Explanation:
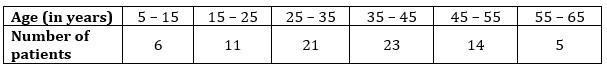
Presented: Highest frequency, which falls within the class range of 60 to 80, is 61.
Modal class = 60 – 80
And and
Mode =

=
=
=
= 60 + 5.625
= 65.625
Thus, the components' modal lives are 65.625 hours.
12. The following data gives the distribution of the total monthly household expenditure of 200 families in a village. Find the modal monthly expenditure of the families. Also, find the mean monthly expenditure:

12. The following data gives the distribution of the total monthly household expenditure of 200 families in a village. Find the modal monthly expenditure of the families. Also, find the mean monthly expenditure:
Explanation:
Consider Mode: Maximum frequency, in this case, is 40, which corresponds to the class range of 1500–2000.
Modal class = 1500 – 2000
And and
Mode =

=

=
=
= 1500 + 347.83
= 1847.83
Consider Mean:

Suppose mean = 2750, class width = 500
=

Mean = 2750 + 500 (– 0.175) = 2750 – 87.50 = 2662.50
Thus, the family's modal monthly spending is Rs. 1847.83 and its mean monthly spending is Rs. 2662.50.
13. The following distribution gives the state-wise teacher-student ratio in higher secondary schools in India. Find the mode and mean of this data. Interpret the two measures.
13. The following distribution gives the state-wise teacher-student ratio in higher secondary schools in India. Find the mode and mean of this data. Interpret the two measures.
Explanation:
Consider Mode: Maximum frequency, in this case, is 10, which corresponds to the class range of 30 to 35.
Modal class = 30 – 35
And and
Mode = =


= = = 30 + 0.625 = 30.63 (approx.)
Consider Mean:

Suppose mean = 32.5, class width = 5
=

Mean = 32.5 + 5 (– 0.65) = 32.5 – 3.25 = 29.25 (approx.)
Thus, the data's mode and mean are 30.63 and 29.25, respectively. It is also evident from the discussion above that states and the U.T. has a student-to-teacher ratio of 30.63, with a 29.25 average.
14. The given distribution shows the number of runs scored by some top batsmen of the world in one-day cricket matches:
14. The given distribution shows the number of runs scored by some top batsmen of the world in one-day cricket matches:

Explanation:
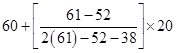
The maximum frequency in the provided data is 18, which falls within the class interval of 4000–5000.
Modal class = 4000 – 5000
And and
Mode =

=
=
=
= 4000 + 608.6956
= 4608.7 (approx.)
As a result, the given data's mode is 4608.7 runs.
15. A student noted the number of cars passing through a spot on a road for 100 periods each of 3 minutes and summarised it in the table given below:
15. A student noted the number of cars passing through a spot on a road for 100 periods each of 3 minutes and summarised it in the table given below:

Explanation:
The maximum frequency in the provided data is 20, which falls within the class range of 40 to 50.
Modal class = 40 – 50
And and
Mode =

=

=
= = 40 + 4.70588 = 44.7 (approx.)
As a result, the given data's mode is 44.7 cars.
16. The following frequency distribution gives the monthly consumption of electricity of 68 consumers of a locality. Find the median, mean and mode of the data and compare them.
16. The following frequency distribution gives the monthly consumption of electricity of 68 consumers of a locality. Find the median, mean and mode of the data and compare them.

Explanation:
Consider Median:

Hence, in this case, the interval is between 125 and 145.
Median class = 125 – 145
and
Now, Median =

=

= = 125 + 12 = 137
Consider Mean:

Suppose mean = 135, Class width = 20

=
Mean = 135 + 20 (0.102)
= 135 + 2.04 = 137.04
Consider Mode:
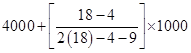
The maximum frequency in the provided data is 20, which falls within the class range of 125 to 145.
Modal class = 125 – 145
,
Mode =

=
=
=
= 125 + 10.76923
= 125 + 10.77
= 135.77
As a result, the data's median, mean, and mode are, respectively, 137 units, 137.04 units, and 135.77 units.
17. If the median of the distribution given below is 28.5, then find the values of and

17. If the median of the distribution given below is 28.5, then find the values of and
Explanation:

Hence, after, also, the Distribution has a median is 28.5, and the interval is between 20 – 30.
Median class = 20 – 30
So, and
……….(i)
Consider Median =


Keeping value in eq. (i), we achieve,
As a result, and have values of 8 and 7.
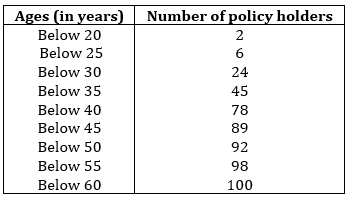
18. A life insurance agent found the following data for the distribution of ages of 100 policyholders. Calculate the median age, if policies are only given to persons having aged 18 years onwards but less than 60 years.
18. A life insurance agent found the following data for the distribution of ages of 100 policyholders. Calculate the median age, if policies are only given to persons having aged 18 years onwards but less than 60 years.
Explanation:

Hence, , after , the interval is between 35 – 40.
Median class = 35 – 40
,
Median =

=

=
=
= 35 + 0.7575
= 35 + 0.76 (approx.)
= 35.76
As a result, the median age of the data is 35.76.
19. The lengths of 40 leaves of a plant are measured correctly to the nearest millimeter and the data obtained is represented in the following table. Find the median length of the leaves.

19. The lengths of 40 leaves of a plant are measured correctly to the nearest millimeter and the data obtained is represented in the following table. Find the median length of the leaves.
Explanation:
We will first make the frequency distribution continuous because it is not currently.

Hence, after , interval is between 144.5 – 153.5.
Median class = 144.5 – 153.5
,
Consider Median =
=
=
= 144.5 + 2.25
= 146.75
Hence, the leaves' median length is 146.75 mm.
20. The following table gives the distribution of the lifetime of 400 neon lamps. Find the median lifetime of the lamps.

20. The following table gives the distribution of the lifetime of 400 neon lamps. Find the median lifetime of the lamps.
Explanation:

21. 100 surnames were randomly picked up from a local telephone directory and the frequency distribution of the number of letters in the English alphabet in the surnames was obtained as follows:
21. 100 surnames were randomly picked up from a local telephone directory and the frequency distribution of the number of letters in the English alphabet in the surnames was obtained as follows:

Explanation:
Consider Median:

Hence, , after , the interval is between 7 – 10.
Median class = 7 – 10
,
Consider Median =

=
=
= 7 + 1.05
= 8.05
Consider Mean:
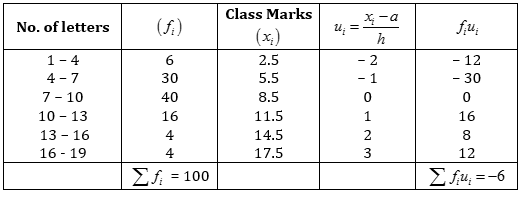
Suppose mean = 8.5, Class width = 3
=

Mean = 8.5 + 3 (– 0.06) = 8.5 – 0.18 = 8.32
Consider Mode:
The maximum frequency in the data is 40, which falls within the class range of 7 to 10.
Modal class = 7 – 10
,
Mode =

=

=
=
= 7 + 0.88 (approx.)
= 7.88
Hence, the data's median, mean, and mode is, respectively, 8.05 letters, 8.32 letters, and 7.88 letters.
22. The distribution below gives the weights of 30 students in a class. Find the median weight of the students.
22. The distribution below gives the weights of 30 students in a class. Find the median weight of the students.
Explanation:

Hence, , after , an interval between 55 – 60.
Median class = 55 – 60
,
Median =

=
=
= 55 + 1.66666
= 5 + 1.67 (approx.)
= 56.67
Hence, the pupils' median weight is 56.67 kg.
23. The following distribution gives the daily income of 50 workers of a factory:

Convert the distribution above to a less-than-type cumulative frequency distribution and draw its ogive.
23. The following distribution gives the daily income of 50 workers of a factory:
Convert the distribution above to a less-than-type cumulative frequency distribution and draw its ogive.
Explanation:

The points are now drawn on the graph.
i.e., (120, 12); (140, 26); 160, 34); (180, 40); (200, 50)
Scale: On the axis, 10 units are equal to 10 rupees and on the axis, 10 units are equal to 5 workers.

24. During the medical checkup of 35 students of a class, their weights were recorded as follows:
Draw a less than type ogive for the given data. Hence obtain the median weight from the graph and verify the result by using the formula.
24. During the medical checkup of 35 students of a class, their weights were recorded as follows:
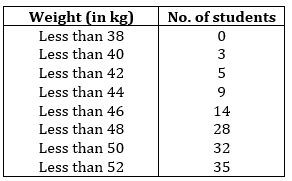
Draw a less than type ogive for the given data. Hence obtain the median weight from the graph and verify the result by using the formula.
Explanation:

Thus, the graph's data points are:
(38, 0), (40, 3), (42, 5), (44, 9), (46, 14), (48, 28), (50, 32), (52, 35)
Scale: On the axis, 10 units are equal to 2 kg and on the axis, 10 units are equal to 5 students.

According to the graph above, the Median weight, which is in the range of 46 to 48, is 46.5 kg.
Hence, , after , an interval between 46 – 48.
Median class = 46 – 48
,
Consider, Median =

=
=
= 46 + 0.5
= 46.5
Hence, the average student weighs 46.5 kg.
25. The following table gives the production yield per hectare of wheat of 100 farms in a village.
25. The following table gives the production yield per hectare of wheat of 100 farms in a village.

Explanation:

The graph's points are as follows:
(50, 100), (55, 98), (60, 90), (65, 78), (70, 54), (75, 16)
Scale: On the axis, 10 units equal 5 kg/ha and On the axis, 10 units equal 10 forms.


CHAPTER-14, STATISTICS